Excel
- Data, Systems
First released in 1985 Microsoft Excel has for decades been one of the world's most well known and widely used software programs. Its success has in large part been driven by its basic spreadsheet features, which provide a simple and transparent mechanism for organising, processing and viewing data. Many organisations limit their use of Excel to these basic features, but it is a tool which offers comprehensive functionality for more complex tasks such as Data Visualisation, Analytics & Automation. As a core component of the MS Office Suite, Excel is available to the majority of organisations at no additional cost and is well understood by team members. As such it is often used in a valuable first steps in improving processes, data and overall performance.
Data Organisation & Calculations:
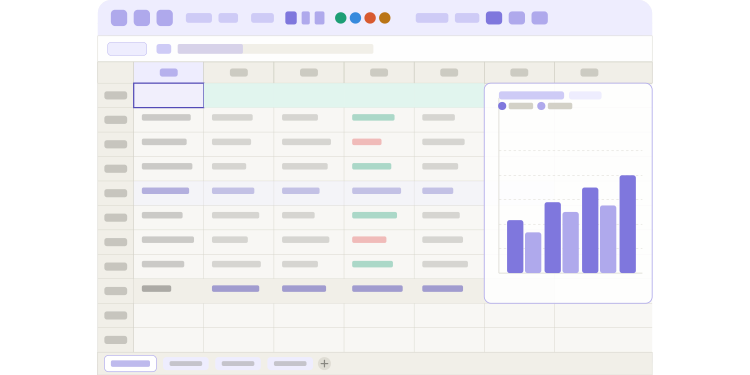
The rows & columns structure of Excel spreadsheets is immediately intuitive to any user, providing the most elementary way to store and label numeric data. Data can be organised into tables, with formulas used to provide totals across the rows & columns, formatting to highlight notable numbers and filtering options available to focus on key areas. Beyond this there is a huge range of formulas available to perform almost any calculation, which can use data from other sheets in the same and other files. These basic features are the most well known tools in Excel, in part because they are the easiest to apply but also because they offer the most immediate potential for time saving benefits.
Data Visualisation:
Excel offers a wide range of data visualisation tools which can be used to transform data into clear and actionable insights. This includes a portfolio of charts and visualisations; column charts, line charts, pie charts, area charts, hierarchies, statistical distributions and waterfall charts. These can be modified according to requirements and can be combined into interactive dashboards, which allow users to easily select and manipulate key metrics to drill-down into the data and obtain detailed understanding of the subject matter and its trends. Updating visualisations can be automated, via database inputs and also via simple copy-pasting of data into specified sheets.
Advanced Analytics & Reporting:
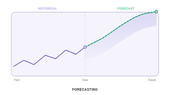
Beyond the simple and well known analytical functionality of Excel it offers more advanced tools. Pivot Tables can be created from a dataset and then used to process and dissect the data in myriad ways, quickly providing comprehensive insights. These Pivot Tables can then be linked to external data sources, providing automated updates when required. Excel also offers 'What If' analysis capability, enabling users to simulate and forecast outcomes.
Automation:
In addition to automated reporting, via formulas, Pivot Tables and data connections, Excel has its own programming language - VBA - which can be used to automate repetitive tasks. This can include any operation manually possible in Excel, working across files and folder structures. As an example, VBA can be used to automate a new customer file creation process- when a lead converts to a customer a button can simply be pressed which then creates a folder structure for that customer and its project of work, containing all necessary files prepopulated with the relevant information. If applied correctly VBA can provide significant output improvements with no additional cost.
Due to its position as a existing tool in most organistions, Excel often forms the basis of first steps towards improving business performance. For any organisation with a minimal understanding of its capabilities there will be simple improvements possible that can transform processes, and the inherent complexity of larger organisations means they can benefit from its full range of features.